The weekly market analysis pages have been updated for trading week 4 (January 22nd - January 27th). Use the links below to view the individual market analysis pages:
The table below shows the market outlook based on each study.
Visit the links above to view the full analysis reports for all GCC markets.
Enjoy.
Showing posts with label Pattern Matching. Show all posts
Friday, 21 January 2011
Saturday, 23 October 2010
Weekly Market Analysis (Week 44)
The weekly market analysis pages have been updated for trading week 44 (October 23rd - October 28th). Use the links below to view the individual market analysis pages:
The table below shows the market outlook based on each study.
The outlook for the Dubai market moves bearish this week after several weeks of positive price movement. However, the Abu Dhabi market remains bullish across all studies, as does the Muscat market.
After last week's 1.15% fall the outlook for Saudi stock market remains on the bearish side.
Visit the links above to view the full anaysis reports for all GCC markets.
Enjoy.
Saturday, 18 September 2010
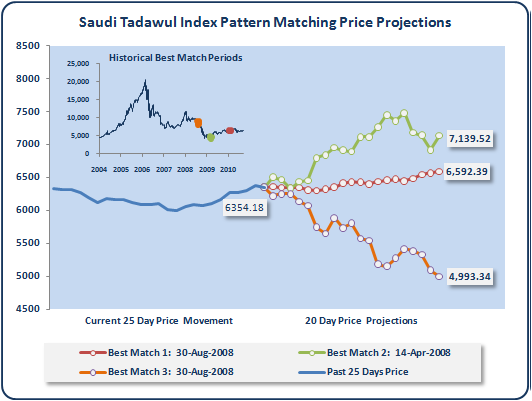
More Price Projections Using Pattern Matching
In the last post I described a method of formulating price projections based on a pattern matching approach applied to the DFM General Index. Below are the price projections for the other GCC indices.
As a reminder, the pattern matching approach can be summarised as follows (for a more detailed explanation see the previous post here):
Enjoy.
As a reminder, the pattern matching approach can be summarised as follows (for a more detailed explanation see the previous post here):
- Compare the current 25 day index price movement against all previous 25 day price movements
- Select the three matches that correlate most closely with the current 25 day price movement
- Note the subsequent 20 day price movements for each of the three best matches
- Project the current price 20 days into the future based on subsequent price movements of the three best matches
Enjoy.
Labels:
Pattern Matching
Bookmark this post: |
Subscribe to:
Posts (Atom)