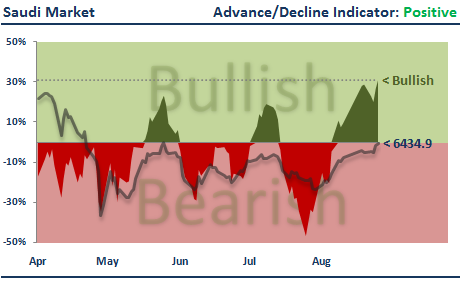
This is the second in a series of posts evaluating the performance of the studies presented in the weekly market analysis report (see first post here).
This post will look at the performance of the market breadth analysis. Market breadth is measured using the 20-day advance/decline indicator. When the advance/decline indicator is greater than zero this tells us that more stocks have risen in price than fallen. When the indicator is less than zero more stocks have declined in value. (See the following post for more details on this indicator and how it is calculated: Part I, Part II and Part III)
On the charts below I've highlighted the market breadth for each GCC Index from August to December 2010. The green shaded areas denote periods when market breadth was positive and red shaded areas are the negative breadth periods.
I think it's fair to say that the charts above show that the market breadth analysis has done a pretty good job of identifying bullish and bearish periods.
Here are the actual performance figures:
Under positive market breadth (first column) GCC markets have tended to perform strongly, much more so than when breadth was negative (second column).
For example, under positive market breadth the DFM General Index returned +21.79% whilst the Index lost -9.40% during negative breadth periods.
The performance during positive market breadth periods beat total index returns (third column) for 5 out of the 7 GCC markets.
In conclusion, as with the trend analysis I reviewed in the last post, market breadth has performed very well over the past 5 months. For all GCC markets positive breadth has been associated with rising index levels whilst negative breadth has been associated with falling for flat index levels.
Enjoy.
Showing posts with label Market Breadth. Show all posts
Tuesday, 11 January 2011
GCC Market Breadth Performance Review
Labels:
GCC Index Analysis,
Market Breadth
Bookmark this post: |
Saturday, 23 October 2010
Weekly Market Analysis (Week 44)
The weekly market analysis pages have been updated for trading week 44 (October 23rd - October 28th). Use the links below to view the individual market analysis pages:
The table below shows the market outlook based on each study.
The outlook for the Dubai market moves bearish this week after several weeks of positive price movement. However, the Abu Dhabi market remains bullish across all studies, as does the Muscat market.
After last week's 1.15% fall the outlook for Saudi stock market remains on the bearish side.
Visit the links above to view the full anaysis reports for all GCC markets.
Enjoy.
The table below shows the market outlook based on each study.
The outlook for the Dubai market moves bearish this week after several weeks of positive price movement. However, the Abu Dhabi market remains bullish across all studies, as does the Muscat market.
After last week's 1.15% fall the outlook for Saudi stock market remains on the bearish side.
Visit the links above to view the full anaysis reports for all GCC markets.
Enjoy.
Monday, 4 October 2010
Weekly Market Breadth Analysis (Week 41)
Both the Saudi and Kuwait markets slipped into negative breadth territory at the end of last week. The other GCC markets maintain their positive breadth and bullish outlook.
To find out how each individual GCC market has performed during periods of positive and negative market breadth please refer to this previous post.
Enjoy.
To find out how each individual GCC market has performed during periods of positive and negative market breadth please refer to this previous post.
Enjoy.
Labels:
Market Breadth
Bookmark this post: |
Sunday, 26 September 2010
Weekly Market Breadth Analysis (Week 40)
Good news. All GCC markets are now displaying positive market breadth. Historically, this has provided a bullish outlook for the GCC markets.
To find out exactly how bullish each individual GCC market has performed during positive market breadth periods please see this previous post.
Enjoy.
To find out exactly how bullish each individual GCC market has performed during positive market breadth periods please see this previous post.
Enjoy.
Labels:
Market Breadth
Bookmark this post: |
Monday, 20 September 2010
Weekly Market Breadth Analysis (Week 39)
The market breadth analysis remains the same as last week. All GCC markets except for Bahrain are currently experiencing positive market breadth and, therefore, have a bullish market outlook. Bahrain's market breadth breadth remains negative, but less so than last week.
Enjoy.
Enjoy.
Labels:
Market Breadth
Bookmark this post: |
Monday, 13 September 2010
Weekly Market Breadth Analysis (Week 38)
Apart from Bahrain, all GCC markets are displaying positive market breadth this week. To understand what this might mean for future price action please see here and here.
For an explanation of how to interpret the charts below please see here.
Enjoy.
For an explanation of how to interpret the charts below please see here.
Enjoy.
Labels:
Market Breadth,
Market Outlook
Bookmark this post: |
Tuesday, 7 September 2010
Market Breadth: Part III
In Part I and Part II of the series on market breadth I introduced the advance/decline indicator and showed how it could be applied to GCC markets to identify upcoming bullish and bearish price action.
In this post I want to introduce a new study based on the advance/decline indicator which I'll update on a weekly basis. Here's an example of the study for the Kuwait market:
The chart shows the last 100 days activity for the advance/decline indicator and corresponding market index. The solid green and red areas are the 10-day advance/decline indicator. Where the indicator is above the zero level (green area) a higher number of stocks are rising in price than falling. Where the indicator is below the zero level (red area) a higher number of stocks are falling in price than rising.
The dotted line highlights the current advance/decline indicator level which in the chart above is about -5%. Also overlayed on the chart (dark shaded line) is the last 100 days price activity for the market index, in this case the Kuwait Index. There is no price axis for the market index but I have highlighted the most recent closing value.
The last post showed that when the 10-day advance/decline indicator was positive this had a strong historical tendency to correspond with a rising market. On the other hand, when the indicator was negative this tended to correspond with a falling market. For the Kuwait market you can see the advance/decline indicator is currently negative (as of market close 5th Sept.) which, historically, has tended to be bearish for future market price activity.
Over the coming holiday weekend I'll post up-to-date advance/decline studies for all GCC markets.
Enjoy.
In this post I want to introduce a new study based on the advance/decline indicator which I'll update on a weekly basis. Here's an example of the study for the Kuwait market:
The chart shows the last 100 days activity for the advance/decline indicator and corresponding market index. The solid green and red areas are the 10-day advance/decline indicator. Where the indicator is above the zero level (green area) a higher number of stocks are rising in price than falling. Where the indicator is below the zero level (red area) a higher number of stocks are falling in price than rising.
The dotted line highlights the current advance/decline indicator level which in the chart above is about -5%. Also overlayed on the chart (dark shaded line) is the last 100 days price activity for the market index, in this case the Kuwait Index. There is no price axis for the market index but I have highlighted the most recent closing value.
The last post showed that when the 10-day advance/decline indicator was positive this had a strong historical tendency to correspond with a rising market. On the other hand, when the indicator was negative this tended to correspond with a falling market. For the Kuwait market you can see the advance/decline indicator is currently negative (as of market close 5th Sept.) which, historically, has tended to be bearish for future market price activity.
Over the coming holiday weekend I'll post up-to-date advance/decline studies for all GCC markets.
Enjoy.
Labels:
Market Breadth
Bookmark this post: |
Saturday, 4 September 2010
Market Breadth: Part II
In the previous post on market breadth I looked at the advance/decline indicator and how it could be applied to the Dubai market to determine the future price direction of the DFM General Index.
In this post I want to share the results of applying the advance/decline indicator to other GCC markets.
A quick recap. The advance/decline indicator is calculated on a daily basis and represents the net number of rising versus declining stocks as a percentage of the total number of stocks. The daily advance/decline percentages are averaged over a certain number of trading days so the results are smother and easier to interpret.
When the advance/decline indicator in greater than zero this tells us that more stocks have risen in price than fallen. When the indicator is less than zero more stocks have declined in value.
In the previous post I looked at the performance of the DFM General Index when the advance/decline indicator was either above or below zero. The results showed that the Index tended to increase in value when the advance/decline indicator was above zero and decrease in value when it was below zero.
The charts below show the results of applying the advance/decline indicator on other GCC markets. The charts on the left-hand side show the historical price performance of each GCC market index and the corresponding advance/decline indicator. The right-hand charts show the historical performance of each market index (blue line) and the performance of the index when the advance/decline indicator was above zero (green line) or below zero (red line).
As you can see, the above results are similar to those for the DFM General Index in the last post. The performance of all market indexes was significantly better when the advance/decline indicator was above, rather than below, zero. Quite impressive results for such a simple application of the indicator.
In the next post on this topic I'll introduce a study based on the advance/decline indicator which I'll use to evaluate the GCC markets on an ongoing basis.
Enjoy.
P.S. The results above are based on slightly different rules than I used in the last post. In this post I used a 10-day rather than 20-day advance/decline indicator and there was no requirement for the indicator to be greater/less than it was two weeks ago. The reason for the change was simply because the rules used in this post performed more consistently across all markets than did the rules in the last post.
In this post I want to share the results of applying the advance/decline indicator to other GCC markets.
A quick recap. The advance/decline indicator is calculated on a daily basis and represents the net number of rising versus declining stocks as a percentage of the total number of stocks. The daily advance/decline percentages are averaged over a certain number of trading days so the results are smother and easier to interpret.
When the advance/decline indicator in greater than zero this tells us that more stocks have risen in price than fallen. When the indicator is less than zero more stocks have declined in value.
In the previous post I looked at the performance of the DFM General Index when the advance/decline indicator was either above or below zero. The results showed that the Index tended to increase in value when the advance/decline indicator was above zero and decrease in value when it was below zero.
The charts below show the results of applying the advance/decline indicator on other GCC markets. The charts on the left-hand side show the historical price performance of each GCC market index and the corresponding advance/decline indicator. The right-hand charts show the historical performance of each market index (blue line) and the performance of the index when the advance/decline indicator was above zero (green line) or below zero (red line).
![]() |
| [ Click to enlarge ] |
![]() |
| [ Click to enlarge ] |
![]() |
| [ Click to enlarge ] |
![]() |
| [ Click to enlarge ] |
![]() |
| [ Click to enlarge ] |
![]() |
| [ Click to enlarge ] |
As you can see, the above results are similar to those for the DFM General Index in the last post. The performance of all market indexes was significantly better when the advance/decline indicator was above, rather than below, zero. Quite impressive results for such a simple application of the indicator.
In the next post on this topic I'll introduce a study based on the advance/decline indicator which I'll use to evaluate the GCC markets on an ongoing basis.
Enjoy.
P.S. The results above are based on slightly different rules than I used in the last post. In this post I used a 10-day rather than 20-day advance/decline indicator and there was no requirement for the indicator to be greater/less than it was two weeks ago. The reason for the change was simply because the rules used in this post performed more consistently across all markets than did the rules in the last post.
Labels:
Market Breadth
Bookmark this post: |
Tuesday, 31 August 2010
Market Breadth: Part I
Market breadth refers to the level of participation behind market moves. There are several ways of measuring market breadth but in this series of posts I'm going to focus on something called the advance/decline percentage.
The advance/decline percentage is calculated on a daily basis and determines the proportion of stocks that are rising in value versus falling in value. The specific calculations is as follows:
For example, if we have a hypothetical market that comprises of 10 stocks and 7 of these stocks have risen in value on a particular trading day then the advance/decline percentage will be:
In this case there were 60% fewer stocks rising in value than were falling in value.
So, as you can see, if the advance/decline percentage is greater than zero a majority of stocks are rising in value and if it is below zero a majority of stocks are falling in value. The zero level represents equality between the number of rising and falling stocks.
Because the daily advance/decline percentage moves very fast it is typical to use a moving average to smooth the results. For this series of posts I've applied a 20-day moving average to the raw daily advance/decline percentages.
Below is a chart of the DFM General Index and corresponding advance/decline indicator.
As you can see, the 20-day advance/decline indicator oscillates around the zero level (right axis). When the advance/decline indicator is above zero (green shaded area) this signifies that a greater number stocks are rising in value than falling. The more the indicator rises above the zero level the greater the proportion of stocks that are rising versus falling.
When the advance/decline indicator is below zero (red shaded area) this signifies that a majority of stocks are falling in value. The further the indicator is below zero the greater the proportion of stocks that are falling versus rising.
As you might expect, when the DFM General Index has been rallying it has been accompanied by a positive 20-day advance/decline percentage. In bear markets the 20-day advance/decline percentage tends to be negative with a majority of stocks falling in value.
There are two main ways to interpret and use the advance/decline indicator. The first is to use extreme advance/decline levels as an indicator of potential market turning points. The logic here is that when a very high percentage of stocks are participating in a market move this is unsustainable and will be followed by a market reversal.
The other main use is to look for divergences between the advance/decline indicator and market prices. For example, if market prices are making new lows but the advance/decline indicator is not then this might signify a bottom for the market and higher future prices. The logic behind this use of the advance/decline indicator is that where fewer stocks are participating in a market decline this shows a lack of support for that move and a likely turning point. The opposite is true for rising markets.
In future posts I will examine the validity of both uses of the advance/decline indicator on GCC equity markets. To begin with, however, I've tested a simpler use of the indicator which has yielded positive results across all GCC markets.
The chart below shows the performance of the DFM General Index under different advance/decline conditions:
The blue line in the chart above is the price of the DFM General Index since 2004. The green shows the performance of the Index when the advance/decline indicator was positive and higher than it was two weeks ago. The green shows the performance of the Index when the advance/decline indicator was negative and lower than it was two weeks ago.
I arbitrarily chose these rules but they seemed quite intuitive (to me at least). My reasoning was that if a majority of stocks were participating in a market rally and the number of stocks participating was increasing this would be bullish for the future price direction. On the other hand, if a majority of stocks were participating in a market decline and the number of stocks participating is that decline was increasing this would be bearish for future price direction.
The results above show that these simple rules were reasonably effective in identifying periods of increasing and decreasing market prices. The future performance of the DFM General Index when the advance/decline indicator was positive and higher than two weeks ago was bullish (green line). However, the future performance of the DFM General Index tended to be bearish when the advance/decline indicator was negative and lower than it was two weeks ago (red line).
These results were fairly consistent across all GCC markets and I'll present them in Part II. In Part III of the market breadth series I'll introduce a study which I'll use ongoing basis to monitor the advance/decline indicator and it's implications for future market price action.
Enjoy.
The advance/decline percentage is calculated on a daily basis and determines the proportion of stocks that are rising in value versus falling in value. The specific calculations is as follows:
Advance/Decline % = (# of Advancing Stocks - # of Declining Stocks) / # of Stocks
For example, if we have a hypothetical market that comprises of 10 stocks and 7 of these stocks have risen in value on a particular trading day then the advance/decline percentage will be:
(7 - 3) / 10 = 40%
This tells us that 40% more stocks were increasing in price than were decreasing in price. Alternatively, if a majority of stocks have fallen in value, say 8 stocks, then the advance/decline percentage will be:
(2 - 8) / 10 = -60%
In this case there were 60% fewer stocks rising in value than were falling in value.
So, as you can see, if the advance/decline percentage is greater than zero a majority of stocks are rising in value and if it is below zero a majority of stocks are falling in value. The zero level represents equality between the number of rising and falling stocks.
Because the daily advance/decline percentage moves very fast it is typical to use a moving average to smooth the results. For this series of posts I've applied a 20-day moving average to the raw daily advance/decline percentages.
Below is a chart of the DFM General Index and corresponding advance/decline indicator.
As you can see, the 20-day advance/decline indicator oscillates around the zero level (right axis). When the advance/decline indicator is above zero (green shaded area) this signifies that a greater number stocks are rising in value than falling. The more the indicator rises above the zero level the greater the proportion of stocks that are rising versus falling.
When the advance/decline indicator is below zero (red shaded area) this signifies that a majority of stocks are falling in value. The further the indicator is below zero the greater the proportion of stocks that are falling versus rising.
As you might expect, when the DFM General Index has been rallying it has been accompanied by a positive 20-day advance/decline percentage. In bear markets the 20-day advance/decline percentage tends to be negative with a majority of stocks falling in value.
There are two main ways to interpret and use the advance/decline indicator. The first is to use extreme advance/decline levels as an indicator of potential market turning points. The logic here is that when a very high percentage of stocks are participating in a market move this is unsustainable and will be followed by a market reversal.
The other main use is to look for divergences between the advance/decline indicator and market prices. For example, if market prices are making new lows but the advance/decline indicator is not then this might signify a bottom for the market and higher future prices. The logic behind this use of the advance/decline indicator is that where fewer stocks are participating in a market decline this shows a lack of support for that move and a likely turning point. The opposite is true for rising markets.
In future posts I will examine the validity of both uses of the advance/decline indicator on GCC equity markets. To begin with, however, I've tested a simpler use of the indicator which has yielded positive results across all GCC markets.
The chart below shows the performance of the DFM General Index under different advance/decline conditions:
![]() |
| (Note: Results are uncompounded and do not include fees or dividends) |
I arbitrarily chose these rules but they seemed quite intuitive (to me at least). My reasoning was that if a majority of stocks were participating in a market rally and the number of stocks participating was increasing this would be bullish for the future price direction. On the other hand, if a majority of stocks were participating in a market decline and the number of stocks participating is that decline was increasing this would be bearish for future price direction.
The results above show that these simple rules were reasonably effective in identifying periods of increasing and decreasing market prices. The future performance of the DFM General Index when the advance/decline indicator was positive and higher than two weeks ago was bullish (green line). However, the future performance of the DFM General Index tended to be bearish when the advance/decline indicator was negative and lower than it was two weeks ago (red line).
These results were fairly consistent across all GCC markets and I'll present them in Part II. In Part III of the market breadth series I'll introduce a study which I'll use ongoing basis to monitor the advance/decline indicator and it's implications for future market price action.
Enjoy.
Labels:
Market Breadth
Bookmark this post: |
Subscribe to:
Posts (Atom)