Showing posts with label GCC Trend Analysis. Show all posts

Friday, 21 January 2011

Weekly Market Analysis (Week 4)

The weekly market analysis pages have been updated for trading week 4 (January 22nd - January 27th).  Use the links below to view the individual market analysis pages:

Dubai   -   Abu Dhabi  -   Saudi   -   Kuwait   -   Qatar   -   Bahrain   -   Muscat

The table below shows the market outlook based on each study.
Stock Market Outlooks: Dubai, Abu Dhabi, Saudi, Kuwait, Qatar, Bahrain, Muscat
 Visit the links above to view the full analysis reports for all GCC markets.

Enjoy.

Saturday, 8 January 2011

GCC Trend Analysis Performance Review

I've been putting out the weekly market analysis report (in some form or another) for a few months now so I thought it was time to take a periodic look at how each study has performed.

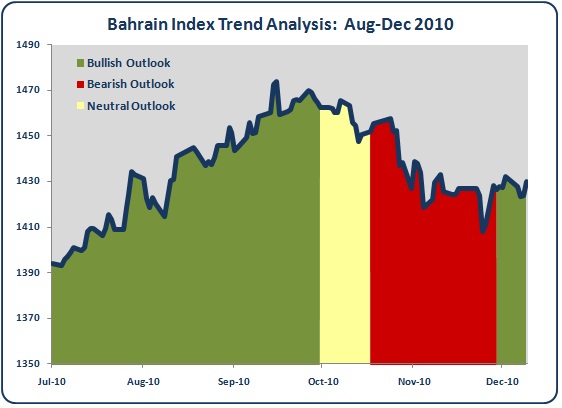
This post will look at the trend analysis performance. As quick recap the trend analysis uses three dual moving averages to determine the current short, medium and long-term trends.  For each GCC market the current trend conditions are compared to previous instances.  If the market has tended to increase in value during previous instances then the predicted outlook is Bullish.  If the market has tended to fall the predicted outlook is Bearish whilst if there is no directional price tendency the outlook is Neutral.

On the charts below I've highlighted the trend outlooks for each GCC Index from August to December 2010.  The green shaded areas denote periods when the trend analysis was forecasting a Bullish outlook.  The red shaded areas denote Bearish outlook periods and the pale yellow areas are for Neutral outlooks.


Just from eyeballing the charts you can seen that the trend analysis has done a reasonable job of identifying rising and falling market moves.

For the number lovers the table below shows the actual performance figures:
The first column shows the percentage return of each GCC index during periods when the predicted outlook was Bullish.  The second column is the percentage return during periods when the predicted outlook was either Neutral or Bearish.  The final column shows the total percentage return for each index from August to December 2010.

The most important takeaway from these figures is that the performance of each market during Bullish outlook periods was significantly better than the performance during the combined Bearish and Neutral periods. This confirms that the trend analysis has managed to predict rising and falling market moves for the GCC markets.  Additionally, the performance during Bullish outlook periods beat total index returns for 4 out of the 7 GCC markets.  Not bad, especially over such a small period of time (Aug-Dec 2010).

In conclusion, the trend analysis looks to be working well and is successfully predicting bullish and bearish market action.

Enjoy.

Saturday, 23 October 2010

Weekly Market Analysis (Week 44)

The weekly market analysis pages have been updated for trading week 44 (October 23rd - October 28th).  Use the links below to view the individual market analysis pages:

Dubai   -   Abu Dhabi  -   Saudi   -   Kuwait   -   Qatar   -   Bahrain   -   Muscat

The table below shows the market outlook based on each study. 

The outlook for the Dubai market moves bearish this week after several weeks of positive price movement.  However, the Abu Dhabi market remains bullish across all studies, as does the Muscat market.

After last week's 1.15% fall the outlook for Saudi stock market remains on the bearish side.

Visit the links above to view the full anaysis reports for all GCC markets.

Enjoy.

Sunday, 10 October 2010

Weekly GCC Trend Analysis (Week 42)

The DFM General Index moves back to a Bullish outlook this week and Saudi moves from Bearish to Neutral. 

All other indices have a Very Bullish outlook, particularly Kuwait, Qatar, Bahrain and Muscat where the all three trend lengths are rising.

Enjoy.

[ Click to enlarge ]
[ Click to enlarge ]
[ Click to enlarge ]
[ Click to enlarge ]
[ Click to enlarge ]
[ Click to enlarge ]
[ Click to enlarge ]
Notes:
1. In the  "Current Trend Conditions" section the short-term, medium-term and long-term trend values are determined by dual moving averages.  The trend value is "Up" when the the shorter length moving average is greater the longer length moving average. The trend value is "Down" when the the shorter length moving average is less then the longer length moving average. For more information on dual moving averages see previous post here.
2. Dual moving average parameters are specific to each index and time-frame (short, medium and long)
3.  The "Outlook" value can be "Very Bullish," "Bullish," "Neutral," "Bearish" or "Very Bearish."  The value is determined by the historical performance of the index when the same short, medium and long-term trend conditions were in evidence in the past.
4. The top chart shows a plot of the historical price performance of the index.  Highlighted on the chart are the past periods when the current trend conditions were in evidence in the past
5.  The bottom chart shows the non-compounded percentage returns of the index when the current trend condition were in evidence in the past. 

Sunday, 3 October 2010

Weekly GCC Trend Analysis (Week 41)

The DFM General Index moves back to a Neutral outlook this week whilst the ADX Index continues to be Very Bullish.

The Saudi Tadawul Index slips to Bearish from Neutral and the trend conditions in both the Kuwait and Bahrain markets have moved into their most bullish phases.

The outlook for the QE Index and Muscat 30 Index continues to be Very Bullish.

Enjoy.

[ Click to enlarge ]
[ Click to enlarge ]
[ Click to enlarge ]
[ Click to enlarge ]
[ Click to enlarge ]
[ Click to enlarge ]
[ Click to enlarge ]
Notes:
1. In the  "Current Trend Conditions" section the short-term, medium-term and long-term trend values are determined by dual moving averages.  The trend value is "Up" when the the shorter length moving average is greater the longer length moving average. The trend value is "Down" when the the shorter length moving average is less then the longer length moving average. For more information on dual moving averages see previous post here.
2. Dual moving average parameters are specific to each index and time-frame (short, medium and long)
3.  The "Outlook" value can be "Very Bullish," "Bullish," "Neutral," "Bearish" or "Very Bearish."  The value is determined by the historical performance of the index when the same short, medium and long-term trend conditions were in evidence in the past.
4. The top chart shows a plot of the historical price performance of the index.  Highlighted on the chart are the past periods when the current trend conditions were in evidence in the past
5.  The bottom chart shows the non-compounded percentage returns of the index when the current trend condition were in evidence in the past. 

Friday, 24 September 2010

Weekly GCC Trend Analysis (Week 40)

No changes in the trend conditions from last week. Most markets remain in either a Bullish or Very Bullish state.

Enjoy.
[ Click to enlarge ]
[ Click to enlarge ]
[ Click to enlarge ]
[ Click to enlarge ]
[ Click to enlarge ]
[ Click to enlarge ]
[ Click to enlarge ]
Notes:
1. In the  "Current Trend Conditions" section the short-term, medium-term and long-term trend values are determined by dual moving averages.  The trend value is "Up" when the the shorter length moving average is greater the longer length moving average. The trend value is "Down" when the the shorter length moving average is less then the longer length moving average. For more information on dual moving averages see previous post here.
2. Dual moving average parameters are specific to each index and time-frame (short, medium and long)
3.  The "Outlook" value can be "Very Bullish," "Bullish," "Neutral," "Bearish" or "Very Bearish."  The value is determined by the historical performance of the index when the same short, medium and long-term trend conditions were in evidence in the past.
4. The top chart shows a plot of the historical price performance of the index.  Highlighted on the chart are the past periods when the current trend conditions were in evidence in the past
5.  The bottom chart shows the non-compounded percentage returns of the index when the current trend condition were in evidence in the past. 

Saturday, 18 September 2010

Weekly GCC Trend Analysis (Week 39)

In a shortened holiday trading week for the GCC markets the only changes to last week's trend outlook is the move from Neutral to Very Bullish for both the ADX Index and the Muscat 30 Index.  The outlook for all other indices remains the same.

Enjoy.


Notes:
1. In the  "Current Trend Conditions" section the short-term, medium-term and long-term trend values are determined by dual moving averages.  The trend value is "Up" when the the shorter length moving average is greater the longer length moving average. The trend value is "Down" when the the shorter length moving average is less then the longer length moving average. For more information on dual moving averages see previous post here.
2. Dual moving average parameters are specific to each index and time-frame (short, medium and long).
3.  The "Outlook" value can be "Very Bullish," "Bullish," "Neutral," "Bearish" or "Very Bearish."  The value is determined by the historical performance of the index when the same short, medium and long-term trend conditions were in evidence in the past.
4. The top chart shows a plot of the historical price performance of the index.  Highlighted on the chart are the past periods when the current trend conditions were in evidence in the past
5.  The bottom chart shows the non-compounded percentage returns of the index when the current trend condition were in evidence in the past. 

Sunday, 12 September 2010

Weekly GCC Trend Analysis (Week 38)

In a shortened three day trading week the DFM General Index still managed to rise an impressive +6%.  This was enough to turn both the short-term and medium-term trends positive and for the overall outlook to turn from Very Bearish last week to Bullish this week.

The same trend changes occurred for the ADX Index but the outlook has only changed to Neutral from Very Bearish. No change in the outlook from last week for the other GCC indices: Saudi = Neutral, Kuwait = Very Bullish, Qatar = Very Bullish, Bahrain = Bullish, Oman = Neutral.

Enjoy.

[ Click to enlarge ]

[ Click to enlarge ]

[ Click to enlarge ]

[ Click to enlarge ]

[ Click to enlarge ]

[ Click to enlarge ]

[ Click to enlarge ]


Notes:
1. In the  "Current Trend Conditions" section the short-term, medium-term and long-term trend values are determined by dual moving averages.  The trend value is "Up" when the the shorter length moving average is greater the longer length moving average. The trend value is "Down" when the the shorter length moving average is less then the longer length moving average. For more information on dual moving averages see previous post here.
2. Dual moving average parameters are specific to each index and time-frame (short, medium and long).
3.  The "Outlook" value can be "Very Bullish," "Bullish," "Neutral," "Bearish" or "Very Bearish."  The value is determined by the historical performance of the index when the same short, medium and long-term trend conditions were in evidence in the past.
4. The top chart shows a plot of the historical price performance of the index.  Highlighted on the chart are the past periods when the current trend conditions were in evidence in the past
5.  The bottom chart shows the non-compounded percentage returns of the index when the current trend condition were in evidence in the past. 

Friday, 3 September 2010

Weekly GCC Trend Analysis (Week 37)

[ Click to enlarge ]

[ Click to enlarge ]

[ Click to enlarge ]

[ Click to enlarge ]

[ Click to enlarge ]

[ Click to enlarge ]

[ Click to enlarge ]


Notes:
1. In the  "Current Trend Conditions" section the short-term, medium-term and long-term trend values are determined by dual moving averages.  The trend value is "Up" when the the shorter length moving average is greater the longer length moving average. The trend value is "Down" when the the shorter length moving average is less then the longer length moving average. For more information on dual moving averages see previous post here.
2. Dual moving average parameters are specific to each index and time-frame (short, medium and long).
3.  The "Outlook" value can be "Very Bullish," "Bullish," "Neutral," "Bearish" or "Very Bearish."  The value is determined by the historical performance of the index when the same short, medium and long-term trend conditions were in evidence in the past.
4. The top chart shows a plot of the historical price performance of the index.  Highlighted on the chart are the past periods when the current trend conditions were in evidence in the past
5.  The bottom chart shows the non-compounded percentage returns of the index when the current trend condition were in evidence in the past.