Tuesday 15 March 2011

Dubai's Default Risk: Better than Portugal, Worse than Egypt

Sheikh Mohammed believes that Dubai has recovered from the impact of the global economic crisis. However, it seems that finincial markets aren't as convinced.

The table below (via the Think Big blog) ranks sovereign credit deafult swap (CDS) prices. CDS's are like insurance policies against a default with higher CDS prices reflecting a higher chance of default.

As you can see, Dubai has a high risk of default ranking.  The fact that Dubai sits between Portugal and Egypt in the rankings says it all.

Of course, markets have been known to be wrong when it comes to pricing risk.  On the other hand leaders and politicians are almost never correct when it comes to making economic predictions (Sheikh Mohammed certainly didn't forsee the meltdown that Dubai's economy experienced over the past two or three years).

The problem for Dubai is that, just like Greece and Ireland, it now has a mountain of debt to service and repay.  That debt is going to be a serious drag on the economy going forward. And judging by the CDS price some investors are predicting that Dubai, in the end, won't be able to pay those debts back in full.


Enjoy.

Saturday 12 March 2011

Weekly Market Analysis (Week 11)

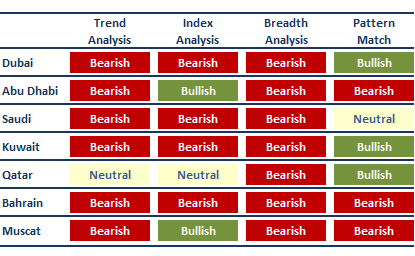
The weekly market analysis pages have been updated for trading week 11 (March 12th - March 18th).  Use the links below to view the individual market analysis pages:

Dubai   -   Abu Dhabi  -   Saudi   -   Kuwait   -   Qatar   -   Bahrain   -   Muscat

The table below shows the market outlook based on each study.
Visit the links above to view the full analysis reports for all GCC markets.

Enjoy.
Sunday 6 March 2011

March Seasonality

Historically, March has been good month for GCC stock markets.  However, that was also the case for February but last month definitely didn't conform to historical tendencies.

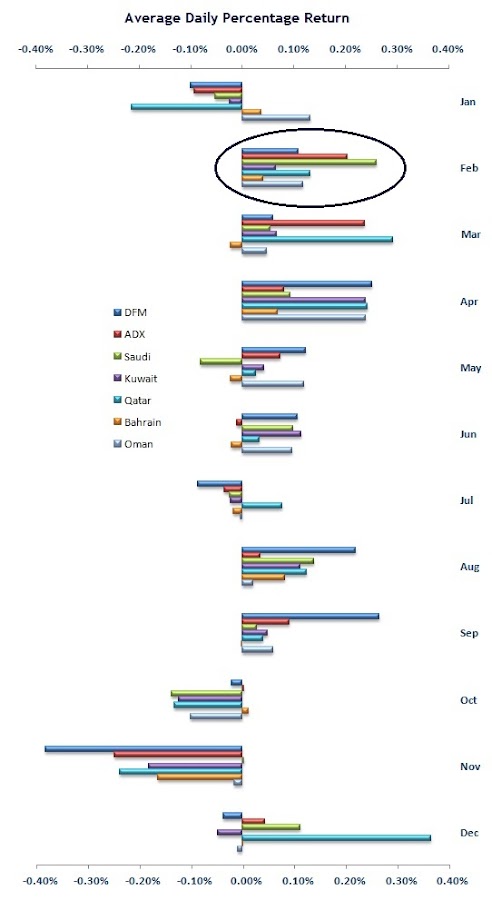
The chart below shows the average daily percentage change for each GCC market during each calendar month.

As you can see, the average daily percentage change during March has been positive for all markets except Bahrain.  However, with the continuing political and social unrest in the region I wouldn't place too much weight in seasonal effects at the moment.

Enjoy.

P.S.  It should be noted that we're dealing with a very small data set for this analysis.  My data only goes back as far as 2004 for GCC equity markets so there have only been seven prior instances of each calendar month. It's hard to draw any concrete conclusions from such a small data set.

Weekly Market Analysis (Week 10)

The weekly market analysis pages have been updated for trading week 10 (March 5th - March 11th).  Use the links below to view the individual market analysis pages:

Dubai   -   Abu Dhabi  -   Saudi   -   Kuwait   -   Qatar   -   Bahrain   -   Muscat

The table below shows the market outlook based on each study.

Visit the links above to view the full analysis reports for all GCC markets.

Enjoy.

Thursday 3 March 2011

GGC Stock Markets Go Oversold

Below are the long-term price and RSI charts for the GCC stock indexes.  With the recent price fall it's not surprising that many markets are now in oversold territory.

In a follow-up post I'll take a look at what these oversold levels mean for the markets going forward.


Enjoy.

Tuesday 1 March 2011

GCC Index Performance: February

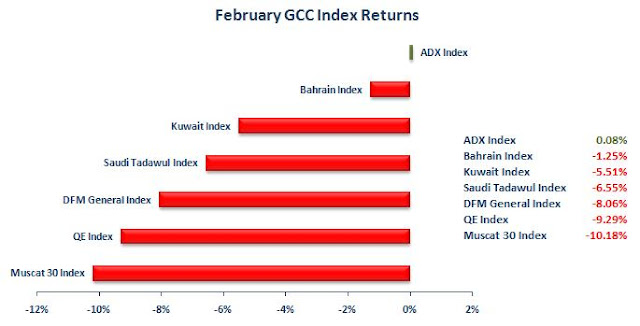
Given the political situation in the MENA region at the moment it's not surprising that February was a bad month for GCC stock markets.

The Muscat 30 Index was the worst performer, dropping by 10.18% with the Qatar market not far behind with a 9.29% fall.  Dubai, Saudi and Kuwait all fell by over 5%.

Despite Bahrain's problems the country's stock index dropped by just 1.25% in February.  However, but for the complete lack of liquidity in the Bahrain market at the moment (many stocks did not trade at all during February) I think the index falls would be a lot, lot worse.

Abu Dhabi was the best performer, managing to eek out a small gain (0.08%) on the month.


On a year-to-date basis the picture doesn't get any better.  All stock indexes are down for the year with the Dubai market having already lost over 13% in 2011.

Enjoy.

Dubai Stocks Make New Bear Market Low

Bad day for the Dubai market yesterday. The DFM General Index was down 3.83% for the day, finished down 8% for the month and made a new barket market low.

The Index closed at 1410.70.  That's the lowest level since the previous bear market low was made in Februrary 2009.  The first time the Index was trading at the current level was.........wait for it.........back in June 2004! 


The good news is that the DFM General Index can only go down another 1,410 points before it hits the zero level.  I'm fairly confident that it can't go any lower than that.

Enjoy.

Saturday 26 February 2011

Weekly Market Analysis (Week 9)

***** Apologies for the hiatus in posting. I've been with sidelined with a particularly nasty and  persistent cold/flu bug for the past couple of weeks. Getting back to normal now though so you can expect regular blog activity. *****  

The weekly market analysis pages have been updated for trading week 9 (February 26th - March 4th).  Use the links below to view the individual market analysis pages:

Dubai   -   Abu Dhabi  -   Saudi   -   Kuwait   -   Qatar   -   Bahrain   -   Muscat

The table below shows the market outlook based on each study.

Visit the links above to view the full analysis reports for all GCC markets.

Enjoy.

Monday 14 February 2011

Divergent Stock Market Performance

US equity markets continue to grind higher.  The S&P 500 Index is currently over 23% higher than it was this time last year and new recovery highs seem to be established almost every other trading session.

But the recent strength in US stocks has not been matched by other markets. The charts below show the performance of several major indices over the past year.  As you can see, the S&P 500 Index is trading at a yearly high .  All other markets, however, are trading well below their highest level over the past year.

I haven't looked into what this divergence in performance may for future stock price direction. But it's interesting, isn't it?

Enjoy.

Saturday 12 February 2011

Weekly Market Analysis (Week 7)

The weekly market analysis pages have been updated for trading week 7 (February 12th - February 18th).  Use the links below to view the individual market analysis pages:

Dubai   -   Abu Dhabi  -   Saudi   -   Kuwait   -   Qatar   -   Bahrain   -   Muscat

The table below shows the market outlook based on each study.
Visit the links above to view the full analysis reports for all GCC markets.

Enjoy.

Friday 4 February 2011

Weekly Market Analysis (Week 6)

The weekly market analysis pages have been updated for trading week 6 (February 5th - February 11th).  Use the links below to view the individual market analysis pages:

Dubai   -   Abu Dhabi  -   Saudi   -   Kuwait   -   Qatar   -   Bahrain   -   Muscat

The table below shows the market outlook based on each study.
Visit the links above to view the full analysis reports for all GCC markets.

Enjoy.

Thursday 3 February 2011

Qatar Market Retreats From Overbought Levels

In a previous post I looked at how the Qatar market was in overbought territory based upon the 20-day Relative Strength Index (RSI).

Well, since that post the Qatar market has fallen by about 5%, causing the RSI to retreat from those overbought levels. 

In the previous post the RSI level for the QE Index was at 80.  The updated chart below shows that the RSI has now fallen to 40.  That's the biggest RSI decline since the start of the market rally back in the summer of 2010.


In the previous post I also looked at the Qatar stocks with the highest RSI levels.  Below are the updated charts for those stocks.  Like the QE Index, they have all retreated from their overbought levels -  but some more than others.


Enjoy.

January Large Cap Monitor

Banks were amongst the big large cap winners in January. Qatar National Bank rose 8.65%, Al Ahli United Bank +7.04% and Emirates NBD +5.43%.   

The biggest fallers were Emaar Properties (-14.08%), First Gulf Bank (-10.68%) and Saudi Telecom (-8.69%).

Enjoy.

[ Click to enlarge ]
[ Click to enlarge ]
[ Click to enlarge ]
[ Click to enlarge ]
[ Click to enlarge ]

[ Click to enlarge ]
[ Click to enlarge ]

February Seasonality

How have GCC stock markets performed during previous February's?

The chart below shows the average daily percentage change for each GCC market during each calendar month.

As you can see, February has tended to be a good month for GCC stocks with all markets showing a positive average daily return.  In fact, from a historical perspective, February through April has been the strongest part of the year for GCC markets.  

Here's hoping this February confirms to historical tendencies.

Month Seasonality for GCC Stock Markets: Dubai, Abu Dhabi, Saudi, Kuwait, Qatar, Bahrain & Muscat
Enjoy.

P.S.  It should be noted that we're dealing with a very small data set for this analysis.  My data only goes back as far as 2004 for GCC equity markets so there have only been seven prior instances of each calendar month. It's hard to draw any concrete conclusions from such a small data set.

Tuesday 1 February 2011

GCC Index Performance: January

Everything went a bit wrong in the final few days of January, brought about by the Egypt situation, of course. 

The Dubai and Abu Dhabi markets are once again the worst performers with the DFM General Index losing 5.90% in January and the ADX losing 4.89%.  Muscat, Bahrain, and Qatar all managed to stay positive for the month, despite suffering late Egypt related falls.

Enjoy.

Monday 31 January 2011

Fox News Covers the Egypt Crisis

This one speaks for itself:


What do you expect, it's Fox News.

Enjoy.

Sunday 30 January 2011

UAE Stock Monitor

The pre-opening market activity for Dubai and Abu Dhabi stocks is indicating a sizable drop this morning.

Regional markets are going to be dominated by what's happening in Egypt.  At the moment the focus is on when and how the current president is "relieved of his duties."  But assuming Mubarak does go the focus will then turn to who and what type of government replaces him.  And the answer to that is none to clear at this point in time.

This uncertainty and the potential for more dominoes to fall is going to put pressure on GCC markets and probably global markets as well.

That said, below are some performance stats for UAE stocks based on Thursday's close.  If stocks do end up being whacked today, however, the picture could change substantially.

Enjoy. 

Key:
  • Close Price: weekly stock closing price
  • Weekly Change:  prior week's percentage stock price change
  • Price > 50-Day Moving Average: is the Close Price greater than previous 50-day average price
  • Price > 200-Day Moving Average: is the Close Price greater than previous 200-day average price
  • Volume > 20-Day Average: is the current volume greater than the previous 20 days average
  • Current Price versus 20-Day Range: where is the current price in relation to the previous 20 days

[ Click to enlarge ]

[ Click to enlarge ]

Saturday 29 January 2011

Unrest in Egypt Spooks Saudi Market

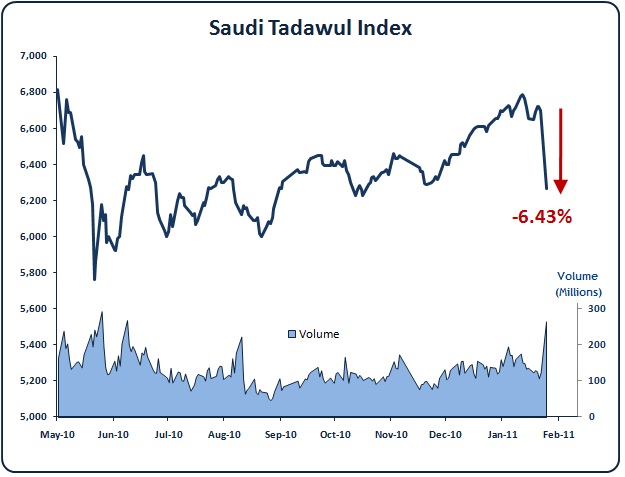
Clearly, the situation in Egypt has made investors in Saudi very nervous.  The Tadawul Index dropped 6.43% today with volume spiking to levels not seen in well over six months.

Saudi Tadawul Index Falls 6.43%

With such a decisive fall you'd expect the other GCC markets to follow Saudi's lead when they open tomorrow.

Unsurprisingly, the countries in the eye of the storm have seen their stock prices sell-off considerably.  The Egypt 30 Index fell by more than 10% on Thursday alone.

Also, oil futures rose by nearly 5% on Friday. That's the biggest one day rise since September 2009.

In short, the financial markets are nervous about the situation in Middle East and the possibility of further contagion in the region.  Things are moving quickly and no one is sure what will happen next. And as everyone is fond of saying, markets hate uncertainty.

Enjoy.

Saudi Stock Monitor

The tables below show the following for each Saudi stock:

  • Close Price: weekly stock closing price
  • Weekly Change:  prior week's percentage stock price change
  • Price > 50-Day Moving Average: is the Close Price greater than previous 50-day average price
  • Price > 200-Day Moving Average: is the Close Price greater than previous 200-day average price
  • Volume > 20-Day Average: is the current volume greater than the previous 20 days average
  • Current Price versus 20-Day Range: where is the current price in relation to the previous 20 days

[ Click to enlarge ]

[ Click to enlarge ]

[ Click to enlarge ]

[ Click to enlarge ]

[ Click to enlarge ]

[ Click to enlarge ]

[ Click to enlarge ]

[ Click to enlarge ]

[ Click to enlarge ]

[ Click to enlarge ]

[ Click to enlarge ]

[ Click to enlarge ]

[ Click to enlarge ]

[ Click to enlarge ]

[ Click to enlarge ]

Enjoy.