Showing posts with label Qatar Analysis. Show all posts

Thursday, 3 February 2011

Qatar Market Retreats From Overbought Levels

In a previous post I looked at how the Qatar market was in overbought territory based upon the 20-day Relative Strength Index (RSI).

Well, since that post the Qatar market has fallen by about 5%, causing the RSI to retreat from those overbought levels. 

In the previous post the RSI level for the QE Index was at 80.  The updated chart below shows that the RSI has now fallen to 40.  That's the biggest RSI decline since the start of the market rally back in the summer of 2010.


In the previous post I also looked at the Qatar stocks with the highest RSI levels.  Below are the updated charts for those stocks.  Like the QE Index, they have all retreated from their overbought levels -  but some more than others.


Enjoy.

Saturday, 15 January 2011

Qatar Market in Overbought Territory

The Qatar market continues to advance higher.  The QE Index is up 9% since the 2022 World Cup announcement on December 2nd.  Clearly there's a lot of optimism surrounding Qatar at the moment.

However, the Relative Strength Index (RSI) is signaling that the Qatar market is in overbought territory.  For those not familiar with the RSI see here.  In short, the RSI is a momentum measure that oscillates between zero and 100.  When the RSI is below 30 this signals that the stock or index is oversold.  When the RSI is above 70 this signals an overbought stock or index.

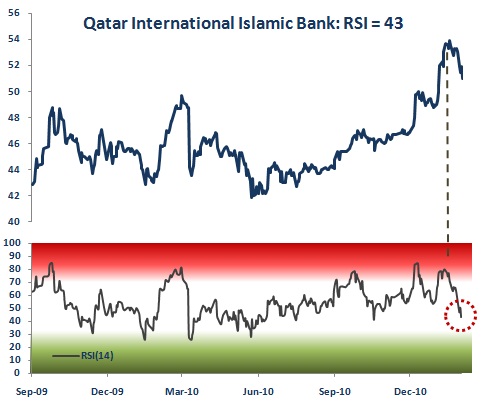
That chart below shows the QE Index (top chart) along with the 14-day RSI indicator (bottom chart).  The green shaded area represents oversold RSI levels and the red shaded area overbought levels.


Qatar Stock Market Relative Strength Index
As you can see, the RSI for the QE Index is currently above 80, well into overbought territory.  Does this mean a big sell-off is imminent?  Not necessarily. When a stock or market does get this overbought it is certainly vulnerable to a sizable sell-off.  For example, the first two overbought occurrences highlighted on the chart above resulted +10% market falls.

But more recent overbought levels have just been met with a pause or mild pullback prices. So, on its own, a high RSI level isn't a reason to sell (especially when the weekly market analysis of the Qatar market is so bullish).  However, entering the market at such overbought levels probably isn't a good idea either and certainly wouldn't provide a good risk-to-reward trade.

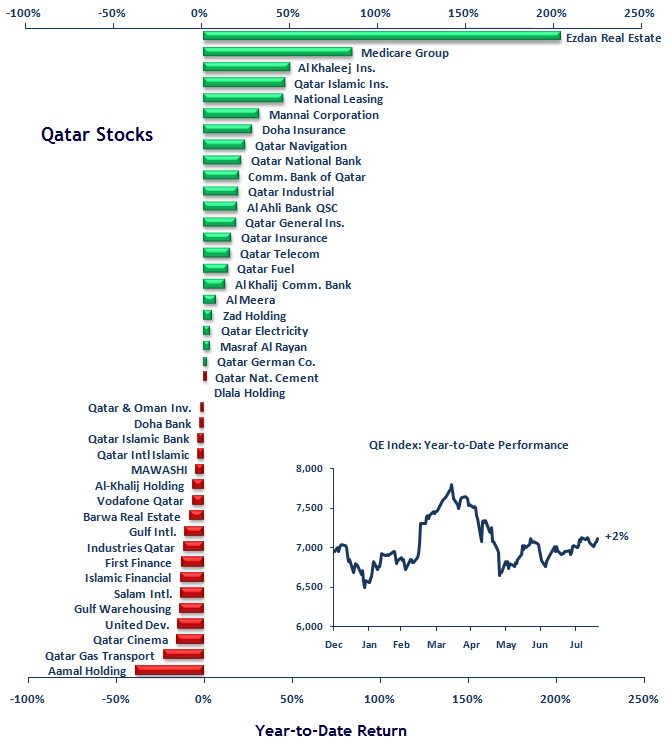
At the very least when the RSI level for a stock or index is above 70 this should be taken as a "proceed with caution" signal.  With that in mind below are the Qatar stocks with the highest current RSI levels.

Qatar Insurance Relative Strength Index


Qatar International Islamic Bank Relative Strength Index


Qatar Islamic Bank Relative Strength Index


Masraf Al Rayan Relative Strength Index


United Development Co. Relative Strength Index
Enjoy.

Sunday, 2 January 2011

Qatar Stocks: 2010 Winners & Losers

Qatar was where the action was in 2010 with the market rising by 25%.

The table below (click to enlarge) shows the 2010 percentage returns for Qatar stocks.
[ Click to Enlarge ]
Enjoy.

Tuesday, 7 December 2010

Qatar Stocks: Year-to-Date Returns

With the Qatar market performing so strongly I'm taking a closer look a what stocks have been driving the market.  In the last post I looked at relative strength.  In this post I'm focusing on pure returns.  In short, which Qatar stocks have risen the most and should have been in our portfolios this year.

The first chart below shows the year-to-date return for each Qatar stock.
 
Qatar Stocks: Year-To-Date Returns

Not surprisingly, a good portion of Qatar stocks have risen by 20 per cent or more so far this year. The charts below show the year-to-date price performance for the top ten returning Qatar stocks.


Excellent returns but also lots of significant drawdowns along the way for many of the above stocks. Which just goes to show, even where you end up picking a winner there's still plenty of volatility to endure in order to capture the big returns.

Enjoy.

Qatar Stocks: Relative Strength Rankings

Qatar is where it's all happening at the moment so I thought I'd do a couple of posts looking into what stocks are leading the way in that market.

This post focuses on relative strength.  The table below ranks each Qatar stock by the relative strength of its price action over three time periods: 20, 50 and 100 days.

For each stock there are three colour spectrums corresponding to each time period.  When the black diamond is at the green end of the spectrum this indicates that the current price of the stock is towards the upper end of its trading range over a particular time period. When the black diamond is at the red end of the spectrum this indicates that the stock is towards the lower end of its trading range.

As you would expect from a market that has performed so strongly over the past six months there are a number of stocks that are displaying very strong relative strength over the all three time periods (the highest ranked stocks in the table below).

That said, there are also a number of stocks that are displaying quite week relative strength. So, even in a hot market such as Qatar there are still leaders and laggards.


In the next post I'll take a quick look at what stocks have performed best on a absolute basis, i.e. which Qatar stocks have risen the most so far this year.

Enjoy.

Monday, 6 December 2010

Qatar Market Jumps on World Cup Euphoria

The QE Index finished up +3.57% on Sunday, the first trading session following the announcement of Qatar's successful 2022 World Cup bid.

However, the Index opened up nearly 7% higher and reach was almost 8% higher at one point during the trading session.  So although the Index finished much higher than Thursday's close it was considerably off its intraday highs. Intraday traders most likely had a bad day yesterday. 

The QE Index closed at 8,477.32, the highest closing value in more than two years.

The move up was accompanied by high volume. In fact, by my data I make it the highest volume day since early June 2009. 

Qatar Index Jumps +3.57%

The QE Index is currently up over 21% for the year.  That's way better than any other GCC equity market.  The question now, of course, is what next?   

Enjoy.

Friday, 20 August 2010

Qatar Stocks: Year-to-Date Performance