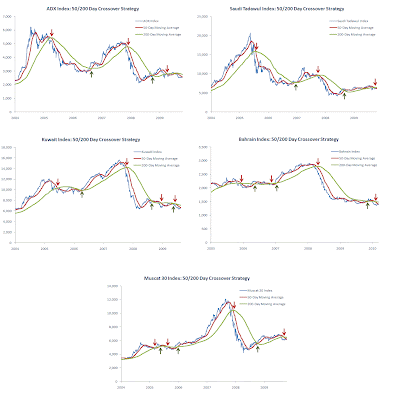
In this post I will test the crossover strategy on other GCC indices: ADX Index, Saudi Tadawul Index, Kuwait Index, Bahrain Index and the Muscat 30 Index.
Firstly, here are the index price charts with corresponding 50-day and 200-day moving average overlays:
 |
| [ Click to enlarge ] |
And here are the P&L charts showing the crossover strategy returns versus buy and hold (Note: starting capital = $1,000, profits are reinvested, results do not include fees, slippage or dividends):
 |
| [ Click to enlarge ] |
Finally, below are the various performance statistics:
 |
| [ Click to enlarge ] |
Conclusion
As highlighted in the previous post, the 50/200 day moving average crossover strategy is a long-term system which aims to exploit long-term trends in market prices. As such, the performance of the crossover strategy needs to be evaluated over a long time frame - as I did with the S&P 500 Index test which went back to 1970.
The tests above, however, are only over a six year period. This doesn't make the results useless, just that we can be less confident of extrapolating the future performance of the strategy based on the shorter test period.
That said, the results above are in line with what we would expect from the 50/200 day moving average crossover strategy. The strategy beats buy and hold on all indices although by varying degrees. The maximum drawdown in P&L was significantly reduced when compared with buy and hold as was the average drawdown. Finally, because the strategy managed to sidestep the worst of the market declines the time spent invested was considerably less than buy and hold.
In summary, when tested on GCC indices the 50/200 day moving average crossover strategy achieved better returns than buy and hold with less drawdowns and less time spent invested.
Readers may ask: "why use 50 and 200 day moving averages rather than another combination, such as 49 and 199 day moving averages?" It's a fair question. The answer is that the 50/200 day moving average strategy is a specific example of what are collectively referred to as dual moving average strategies. The 50/200 day moving average combination just happens to be the standard and most popular version of this type of strategy.
In the next post on this subject, however, I will test other combinations to see which pair of moving averages have historically performed best.
Enjoy.

